Demand
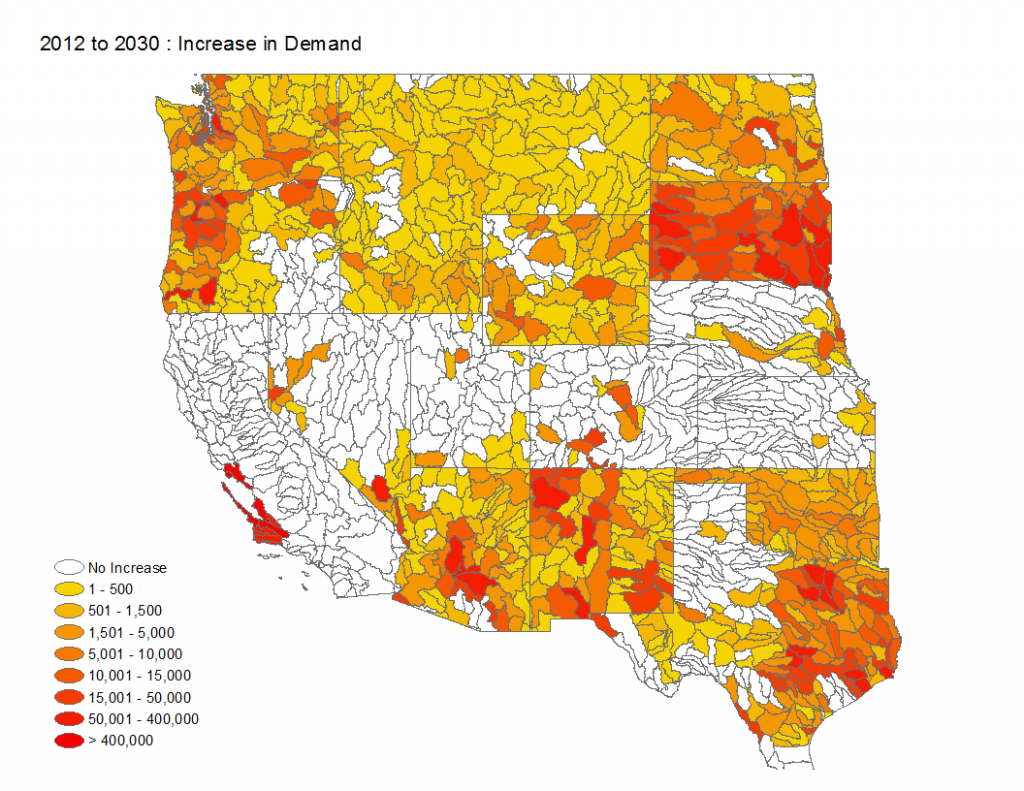
Projected change in demand for water (consumptive use) are mapped below (2030 demand minus current demand). The change in demand is mapped at the same scale as water availability but with the color scale reversed to distinguish areas of higher demand with warmer colors. Worthy of note are the large regions with zero to negative projected future demands (white and blue areas on map). These are regions where the state projects a degree of abandonment of irrigation combined with limited rural population growth. The greatest new demands are associated with metropolitan areas; particularly in Denver and Albuquerque.

Comparison of water availability with projected future demands provides an indication where future consumption will challenge available supplies unless measures are taken. To explore this issue available water sources are aggregated and the projected future demand subtracted to yield a simple water budget at the 8-digit HUC level across the conterminous western U.S. Two budgets are constructed, one that only considers unappropriated water sources and a second that considers all five sources of available water. The unappropriated water budget is constructed as this is generally the first supplies of water that are considered which tend to be the least cost to utilize.
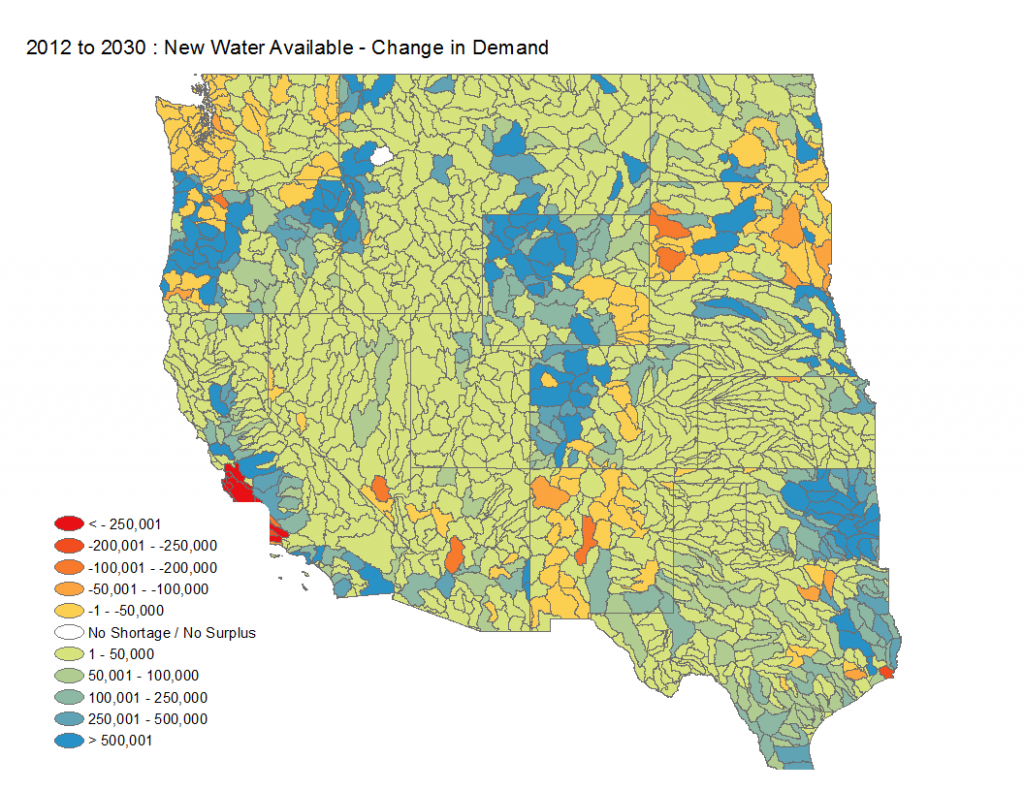
As expected, unappropriated surface and groundwater supplies are unlikely to be sufficient to meet future demands throughout much of the Southwest. This is indicated by the broad areas with negative water budget values, where projected future demand exceeds the available supply (areas mapped as white). The few exceptions are the far East and the intermountain region in Colorado and Utah. There are also a few pockets of negative water budgets in the Northwest, generally in areas of heavy irrigation. In total XX watersheds have 2030 water demands that exceed the available unappropriated surface and groundwater. These watersheds are home to xM people or x% of the western states population.
The picture improves considerably when all five water sources are considered (see map below). Fortunately, appropriated, brackish, and municipal waste water tend to be available in watersheds with limited or no unappropriated water supply. In fact, only xx watersheds have insufficient supplies to meet 2030 demand when all five sources of water are considered. However, these watersheds tend to be associated with areas experiencing strong urban growth; specifically, xM people or x% of the western states population.
It is recognized that in many cases, plans are in place aimed at addressing the identified short fall. Unfortunately, there is a lack of uniform and comparable data on planned projects across the West. Additionally, project planning runs the full spectrum from conceptualization to initial construction. As such, no attempt has been made to quantify “new” sources of water, as there is no means of quantifying such efforts in a consistent and comparable manner.

