The Utah Division of Water Resources has expressed an interest in sharing important water planning and decision-making data with the public and other interested parties using the WSWC’s Water Data Exchange (WaDE) framework. The Division has been developing what is called the Water Budget Model for a number of years and have used the outputs of the model for various applications, including smaller basin planning, and modeling of the Great Salt Lake. The Water Budget Model is complex in that it is essentially an ensemble model composed of many input parameters that are often the results of other models or refinements of existing data themselves. The many inputs, results, and interpretation of the results are discussed in greater detail below, but a conceptual diagram of the model (Figure 1) provides an overview of the model inputs and its flow to desired outputs.
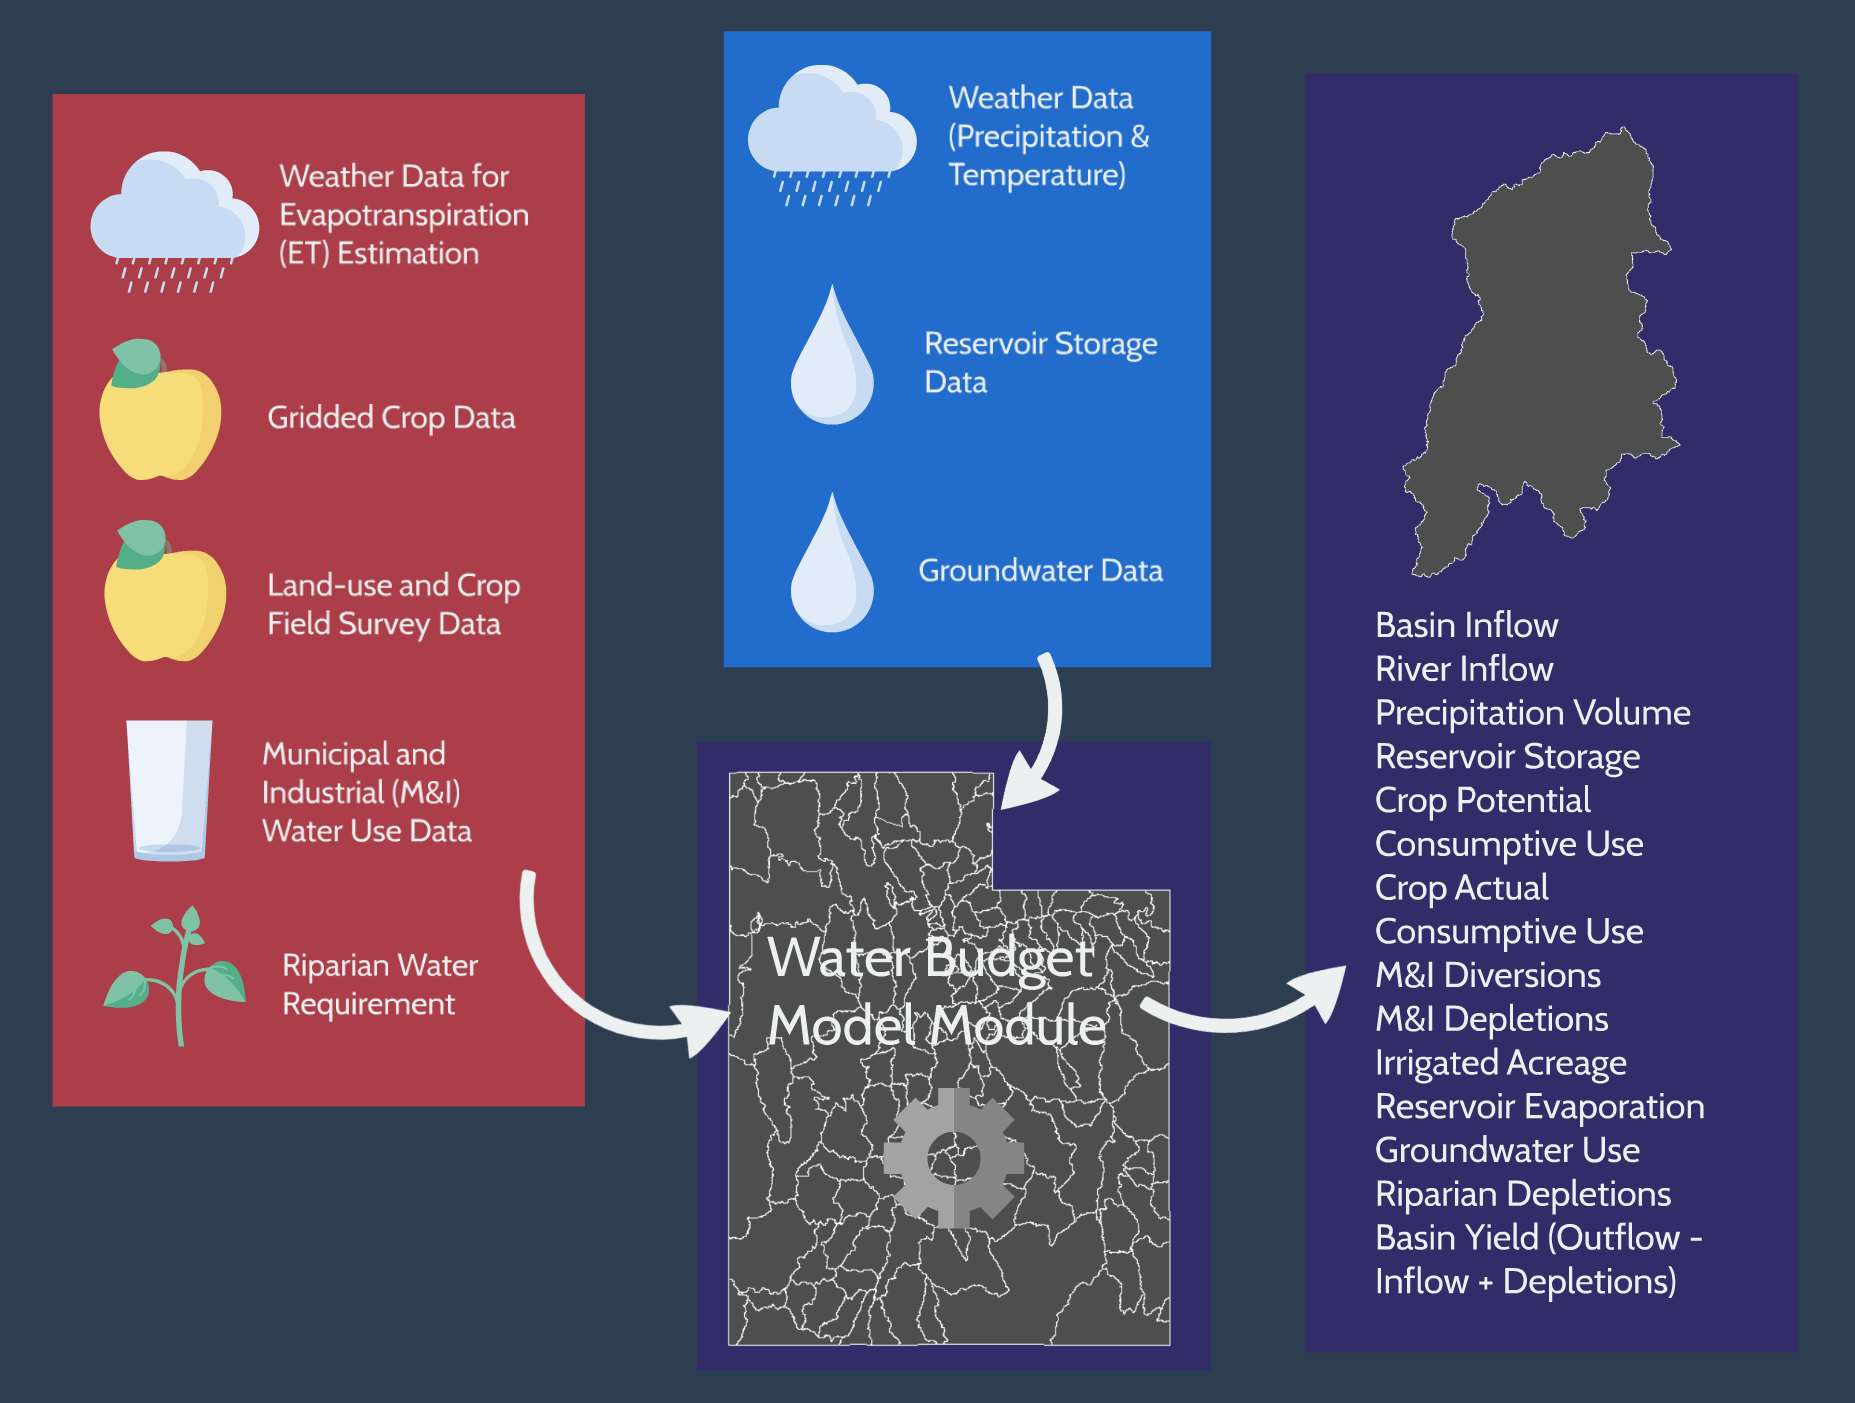
Figure 1. Conceptual Diagram of the Utah Water Budget Model
The resulting data have been migrated to an instance of the WaDE web application, hosted by the State of Utah, that allows the public to view the results in simple tables and charts, but also allow more sophisticated users access to the data in an interoperable (with other states in WaDE) and a machine-readable format (Figure 2).
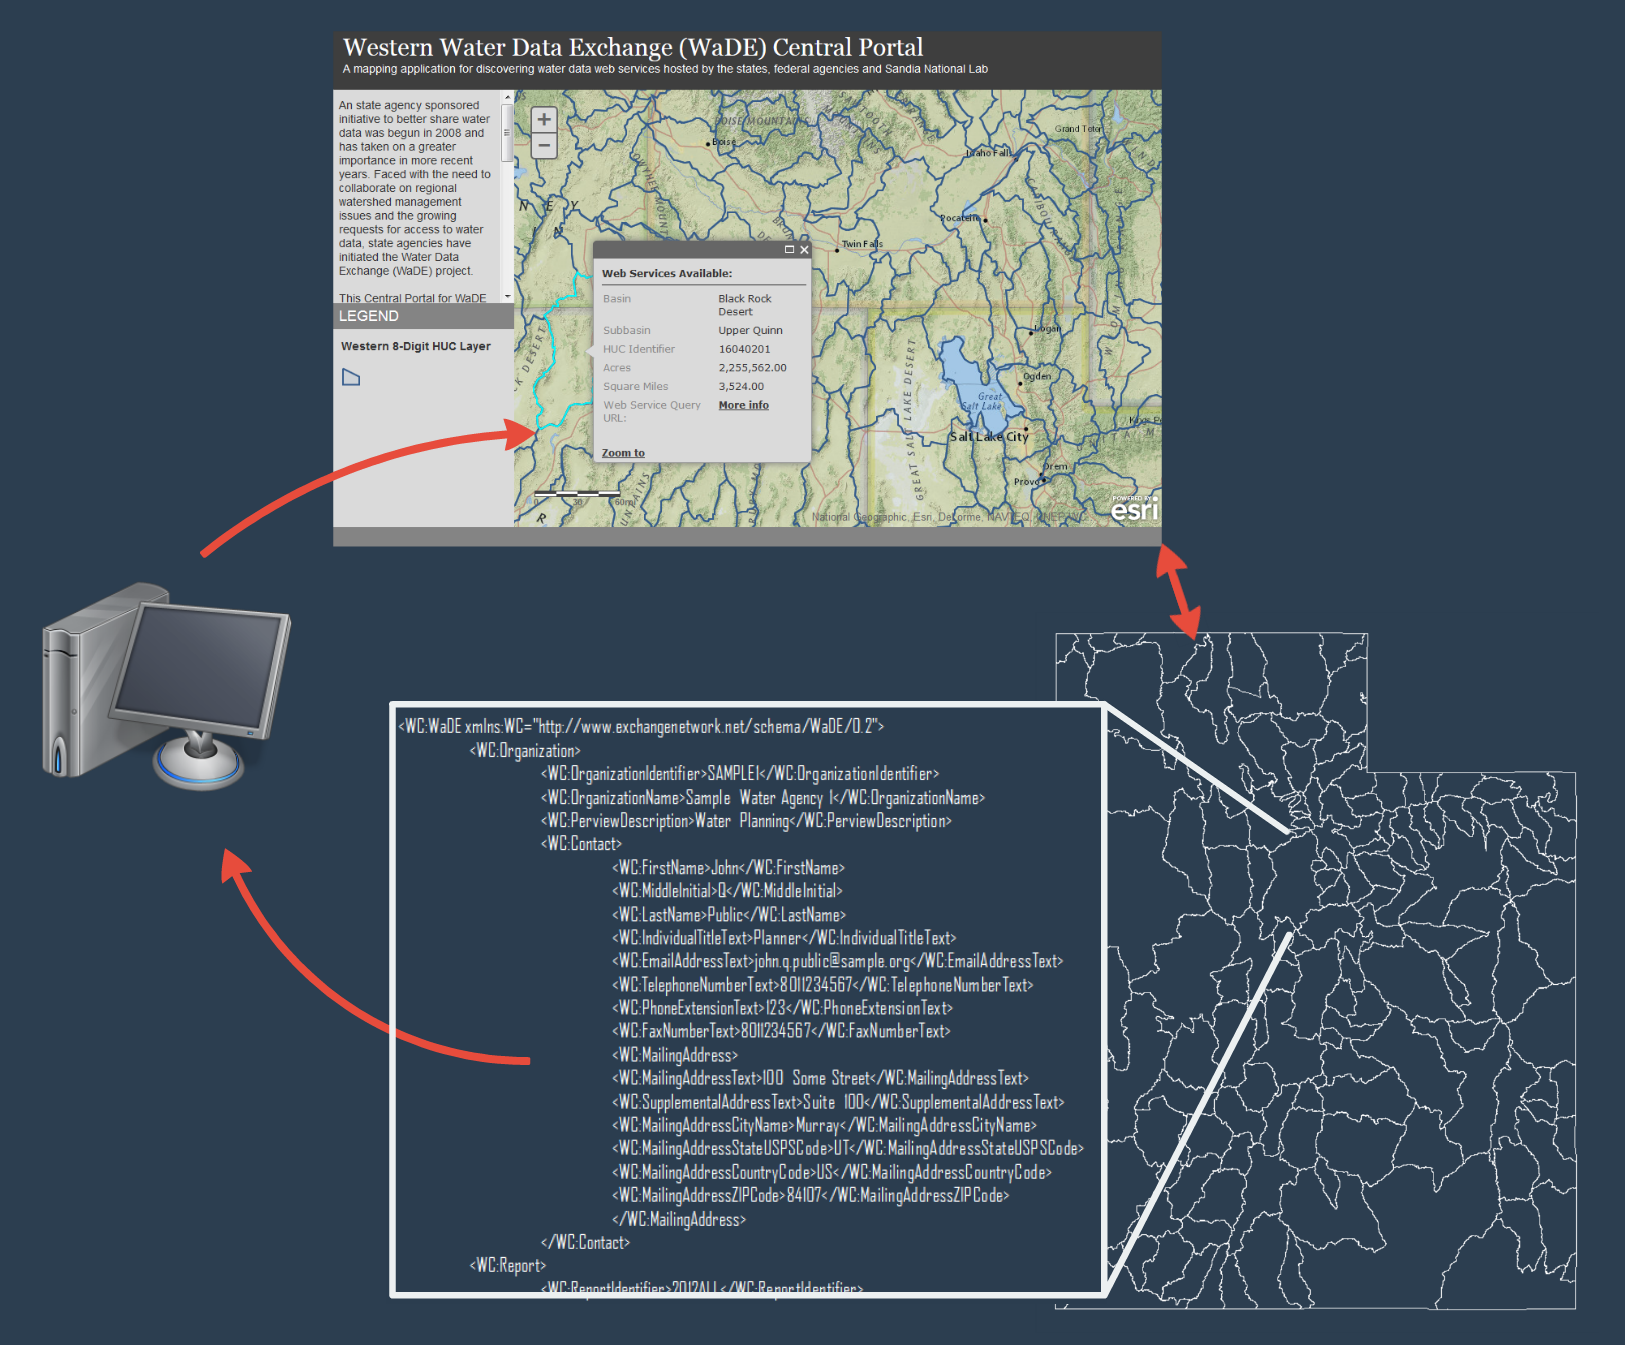
Figure 2. Conceptual Figure of Utah’s WaDE Application
Historical Background for Water Budget Model
The Division of Water Resources had many motivations for creating its Water Budget Model. For planning purposes on both a statewide and basin-by-basin scale, the State would like to understand the total amount of water used from major water supply sources (e.g., surface and groundwater), as well as a breakdown by major economic sector (e.g., such as irrigation or municipal). Understanding both the diversions, extractions, and depletions (water lost to further use by evaporation or transp-evaporation), will assist with water planning by identifying trends, such as changes in land use and irrigation over time, changes in water conservation habits of Utah’s population over time, effects of more efficient irrigation methods, and the basin yield, or how much water remains in the basin for sustainable development. More recently, an audit on water data in the State of Utah, prompted a review of data practices and identified an even greater need for reliable information for decision-makers as they grapple with water infrastructure funding.
Examples of specific issues that require more in depth data are listed below:
- Administration and further development of water in the Colorado River Compact
- The Lake Powell Pipeline Project (diversion from the Colorado River to Southern Utah cities and towns)
- Upper Colorado River Commission irrigation depletion management and estimation of deliveries for Mexico
- Administration and further development of water in the Bear River Compact
- Bear River Project (diversion and storage from the Bear River to cities along the Wasatch Front)
- Great Salt Lake Management
- Basic data requirement to manage the Lake using Integrated Water Resource Management (IWRM) principles
- Evaluating impacts on the Lake, both quantity (lake levels) and quality
- Robust industrial use and activity on the Lake requires greater understanding of impacts
- Wildlife and environmental impacts must also be considered
- Managing for a growing population
- Utah’s population is projected to double from current numbers by 2060
- Managing for periods of drought and for climate change
- Increasing resilience and adaptability will require an understanding of past, current, and future conditions
Notes about the Water Budget Model
From 1989 – 1994, the entire state of Utah was calculated once. The program was suspended until 2006 – 2010. Processes that had to be worked out in the interim included use of USGS Streamstats and the Area-Altitude method for estimates of ungaged flow, additional data entry, updated agricultural land-use and urban land-use data, and return flow factors were added. The entire states was updated in 2012. Data are calculated on a variety of scales, from 12-digit Hydrologic Unit Code (HUC) and larger, and also using the Division’s Land-use Planning Areas, which are similar to an 8-digit HUC.
More Information on Parameters to the Water Budget Model
Weather/Climate-Related Datasets
- PRISM Gridded Weather Data: The PRISM Climate Group’s 30m grid-cell resolution PRISM data for temperature and precipitation are used to estimate precipitation inputs across the state and for the Colorado and Bear River Basins.
- The normal mean annual precipitation for the period of record 1971-2000 (~800 meter grid cells) is applied to each county, and by subarea.
- The monthly mean annual precipitation and temperature for the period of record 1960 – 2009 (~4,000 meter grid cells) is applied to each county and subarea.
- These products are used to calculate each year’s inflow into subareas or HUCs. For more information on how PRISM datasets are developed, please see the PRISM Climate Group’s webpage here.
- Weather Station data (precipitation, temperature, wind, etc.) from AgriMet and other weather station networks that span Utah and the Bear River area. For more information about Agrimet, please see here. For Utah’s Climate Center weather station networks, please see here.
- Temperature and weather data were extracted for irrigated lands within each study area and the required water for plant growth, or evapotranspiration (ET), was calculated for each month and year from 1989-2009, using the modified Blaney-Criddle equation. For more information the methodology involved, please see here.
Surface Water-Related Datasets
- USGS Streamgages: A significant inflow and calibration parameter is gathered by accessing USGS streamgage data for the year of analysis.
- A database of correlation coefficients and base stations has been created to extend or “fill in” important streamgage records that may have data gaps, or other inconsistencies.
- USGS StreamStats and the UT Division of Water Resources Area-Altitude Method: For estimating inflow in ungaged basins.
- For flows estimated from either StreamStats or the Area-Altitude Method, monthly flows are calculated as a proportion of the flow of a base station.
- Reservoir Evaporation: GIS of waterbodies across the state area are intersected with PRISM data to estimate the annual reservoir evaporation for significant surface water sources.
- Stage-area-capacity curves are extracted from previous Division of Water Resources models, from Water Rights database records, and from tables maintained by the Bureau of Reclamation
- Reservoir Storage and Release Records, Elevation-Area-Capacity tables from the State Engineer and US Bureau of Reclamation
- Irrigation and system delivery efficiency for each study area were determined from USU data created for a previous study.
Groundwater and Soil-Related Datasets
- USGS Groundwater Conditions in Utah: Groundwater areas are dis-aggregated into 12-digit HUCs and by subareas within Utah for the year 1989 to 2009.
- Water Rights Data: The Division of Water Rights groundwater wells and points of diversion are used to proportion water from the USGS groundwater use areas to water budget study areas.
- USGS groundwater use areas have been modified to spatially account for where their study wells were actually location in relation to know irrigated agricultural lands.
- Soil Moisture: This is taken from the National Resource Conservation Service STATSGO database. The data are used to estimate the soil-moisture holding capacity for each water budget area
- The Water-Related Agricultural Land-use datasets (described below) is also used to evaluate water budget areas for additional areas of higher soil moisture.
Agricultural Irrigation-Related Water Use Datasets
- Water-Related Agricultural Land-use: The Division conducts surveys of the agricultural lands of Utah on an ongoing basis. These acreages and crop types are used to estimate to estimate evapotranspiration and related water requirement for agricultural activities. These data are dis-aggregated to a county and 12-digit HUC scale For more information on the State’s Water-Related Agricultural Land-Use dataset, please see the Utah AGRC’s webpage here.
- Irrigated cropland areas are used to estimate increases in riparian water use within each water budget study area
- National Agricultural Statistics Service (NASS) Agricultural Dataset: NASS maintains a crop-type coverage annually at 30m resolution. The error is greater than the annual changes in agricultural landuse, but this could be an important source of data once improved.
Urban/Domestic-Related Water Use Datasets
- The Division of Water Resources and Water Rights oversee programs for reporting of water use by municipal and industrial connections and customers. The municipal potable and secondary diversion records are used in the model.
- Annual municipal potable water use is estimated for 1989-2009 period for the following categories within public community and non-community systems: Indoor residential, outdoor residential, commercial, institutional (schools and cemeteries), and industrial.
- Indoor water use is assumed to be constant for each month. Outdoor water use is assumed to vary with the reported “grass/turf” demand reported from the nearest USU weather station.
- Annual secondary water use is estimated for water systems for the period 1989-2009.
- Annual self-supplied industrial water use is estimated for 1989-2009
Utah Water Budget Model Results
For each water budget area (counties and HUCs), for the years 2009 – 2014 at a monthly, water year, and calendar year timescale, the results include:
- Summarized input parameters (precipitation, natural system use, etc.)
- Estimated surface water flows
- Pumped groundwater
- Agricultural and municipal diversions (withdrawals)
- Agricultural and municipal depletions (consumptive use)
- Monthly reservoir operations data
- Basin outflow
- Estimates of basin “yield” and natural depletions
Caveats to the Water Budget Model
As with any model there are assumptions made and uncertainties to the incoming data and the results produced.
- The methodology used to estimate depletions (consumptive use) is a significant influence on the model results. Many states and other entities that have an interest in how ET are crop water requirement are estimated are currently evaluating standards for data, but there are not agreed upon methods at this time. One improvement to the Utah Water Budget model will be updating the methodology to more widely accepted ASCE Penmen-Monteith approach.
- There are no widely-adopted standards for how gridded ET should be determined or applied.
- Ground-truthing of consumptive use data is difficult. Lysimeters are prone to error, while eddy covariance towers are very expensive and require extensive training for data processing.
- Remotely-sensed ET estimation has great potential to resolve some of the error reported above, but can be costly, requires specific training, and can be computationally intensive.
- Estimating streamflows in ungaged basins continues to be a source of uncertainty and error.
- Some municipal data is proprietary and some data are also incomplete. The accuracy of water use reporting varies from district to district
- Related, there are overlapping district boundaries, and out of state data can be difficult to acquire
- Some out-of-state historic data for irrigated acres and crops are problematic
- Reservoir data and capacity curves are difficult to acquire and control
- Some groundwater data is fairly coarse and uses the USGS water use compilation records
Resources used to compile this methodology report include:
- The Utah Water Budget Process – Miller, C.W., 2017. (and related Powerpoint)
- Utah Water Budget Summary Example for the Cedar River Basin Area – Miller, C.W., 2017.
- Class Lecture on the Utah Water Budget Process – Miller, C.W., 2017.