Municipal Wastewater Metric
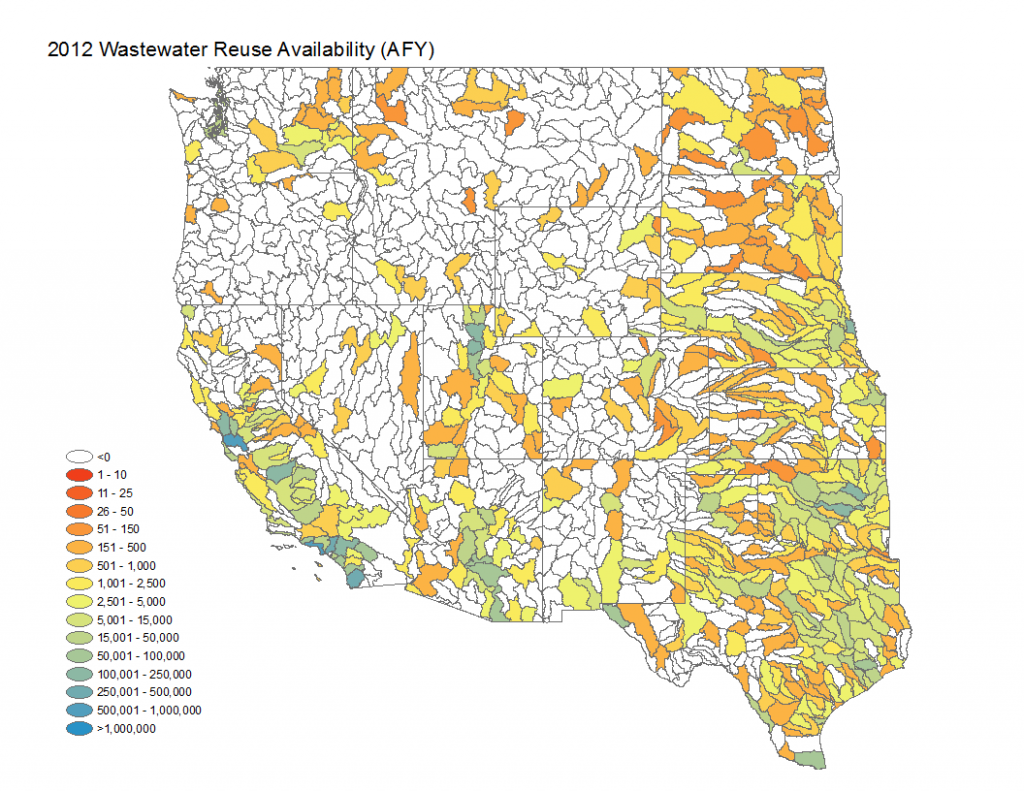
Non-fresh water supplies offer important opportunities for new development. Municipal waste water is rapidly being considered as an alternative source of water for new development, particularly in arid regions. Municipal waste water discharge data is relatively consistently available throughout the U.S. The Environmental Protection Agency publishes a couple of databases (Permit Compliance System (PCS) [fusion_builder_container hundred_percent=”yes” overflow=”visible”][fusion_builder_row][fusion_builder_column type=”1_1″ background_position=”left top” background_color=”” border_size=”” border_color=”” border_style=”solid” spacing=”yes” background_image=”” background_repeat=”no-repeat” padding=”” margin_top=”0px” margin_bottom=”0px” class=”” id=”” animation_type=”” animation_speed=”0.3″ animation_direction=”left” hide_on_mobile=”no” center_content=”no” min_height=”none”][EPA 2011], and Clean Watershed Needs Survey (CWNS) [EPA 2008]) that provide information on the location, discharge, and level of treatment for most waste water treatment plants in the U.S. Additionally, the U.S. Geological Survey (Kenny et al. 2009) publishes municipal waste water discharge values aggregated at the county level. These three sources of information are combined to provide a comprehensive view of current waste water discharge across the West. Additionally, the projected growth in municipal waste water discharge to 2030 is estimated (see future Water Demand section below) is added to the current discharge rates.
However, not all of this discharge is available for future use. A considerable fraction of waste water discharge is currently re-used by industry, agriculture, and thermoelectric generation. Re-use estimates are determined both from the U.S. Geological Survey (Kenny et al. 2009) data as well as the Environmental Protection Agency databases (as they record the point of discharge, e.g., stream, agriculture, power plant). These re-use estimates are subtracted from the projected discharge values.
In western states the availability of municipal waste water must consider return flow credits. Those municipalities that discharge to perennial streams receive return flow credits for treated waste water. This water is not available for new development as it is already being put to use downstream. Unfortunately, there are no comprehensive data on waste water return flow credits. In efforts to identify plants that are likely credited for their return flows, those plants that directly discharge to a perennial stream are identified (point of discharge is identified in the databases noted above). These plants are excluded as a source of available municipal waste water.
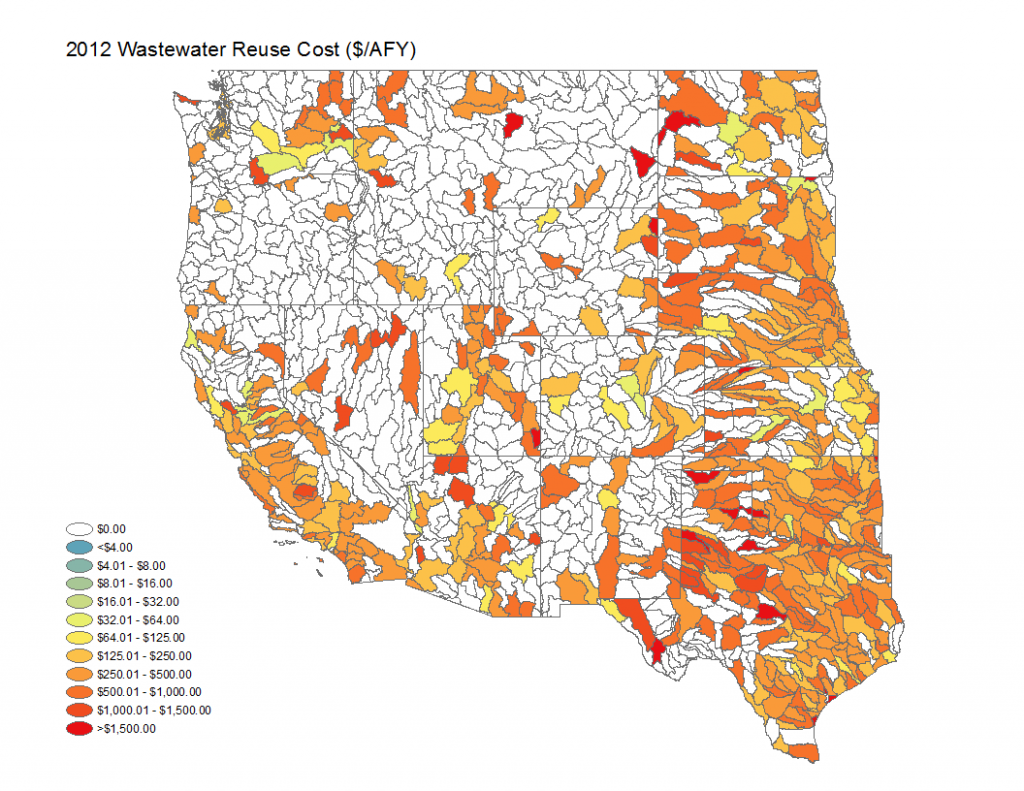
Estimated costs consider expenses to lease the waste water from the municipality, convey the water to the new point of use, and to treat the waste water. Fees charged to lease treated waste water from the municipality were estimated based on the initial work of Electric Power Research Institute (EPRI 2008). Values reported in the EPRI report were verified and updated as necessary based on a review of fees published on line. As no geospatial or plant related trends were noted in the pricing an average of the reported fees was adopted for this study, which was calculated at $0.32 per cubic meter.
Conveyance of treated waste water from the treatment plant to the point of use is a potentially important cost. Considered are both capital construction costs for a pipeline and O&M costs principally related to electricity for pumping. Associated costs calculations are consistent with Watson and others (2003). The key factor in this analysis is the distance between the treatment plant and point of use. Distance values are calculated as a function of the land use density around the existing treatment plant. Land use densities were calculated within a 5 mile buffer around all existing treatment plants with conveyance distances simply distributed according to a rank order of land density with low values given a conveyance distance of 1 mile to the highest land use density given a distance of 5 miles.
It is assumed that all waste water must be treated to advanced standards before it can be re-used. This conservative assumption was adopted considering both realized improvements in downstream operations (e.g., increased cycles of use, reduced scaling, improved feed quality) and the current trend of regulation toward requiring advanced treatment (EPRI 2008). Plants operating at primary or secondary treatment levels (data from EPA [2008 and 2011]) are assumed to be upgraded to advanced standards. Capital construction costs are based on the analysis of Woods et al. (2012), which scale according to treatment plant throughput and original level of treatment. Associated O&M costs consider expenses for electricity, chemicals and labor.
References
U.S. EPA, 2011. Permit Compliance System (PCS) Database, available at www.epa.gov/enviro/facts/pcs/.
U.S. EPA, 2008. Clean Watershed Needs Survey (CWNS), available at www.epa.gov/owm/mtb/cwns/.
Kenny, R.F., N.L. Barber, S.S. Hutson, K.S. Linsey, J.K. Lovelace and M.A. Maupin, 2009. Estimated use of water in the United States in 2005, U.S. Geological Survey Circular 1344, 52p.
EPRI. 2008. Use of Alternate Water Sources for Power Plant Cooling. Palo Alto, CA: Electric Power Research Institute. 10014935.
Woods, G.J., Kang, D., Quintanar, D.R., Curley, E.F., Davis, S.E., Lansey, K.E., Arnold, R.G., 2012. Centralized vs. decentralized wastewater reclamation in the Houghton Area of Tucson, AZ, Journal of Water Resources Planning and Management. Published online April 3, 2012.
To view the sources and processes used to calculate estimates for all metrics, select a state below:
ADWR Basin Water Demand and Supply Data (1991-2009)
[/fusion_builder_column][/fusion_builder_row][/fusion_builder_container]


